TOBIT – A method of trend analysis used to efficiently handle non-detects and incorporate covariates for seasonal and other trends, to produce a self-documenting sequence of images, tables, and an explanatory narrative depicting the results of sophisticated trend analyses
Background: Many methods in common used to evaluate temporal trends in monitoring data rely upon univariate techniques that account for changes in measured concentrations by means of a single variable, namely time. The application of most temporal trend analysis methods in groundwater monitoring – such as parametric ordinary least squares (OLS) or the non-parametric Mann-Kendall test – time is usually the sole explanatory (or independent) variable and measurements of groundwater concentration provide the response (or dependent) variable. With these methods, any variability in concentration values not specifically associated with the time variable is relegated to the “error” term (Equation 1).

EQUATION 1
In EQUATION 1, where y is the sampled concentration, t is time, β0 and β1 are assumed to be constant and are estimated based on the regression method, and ε is the “error” term.
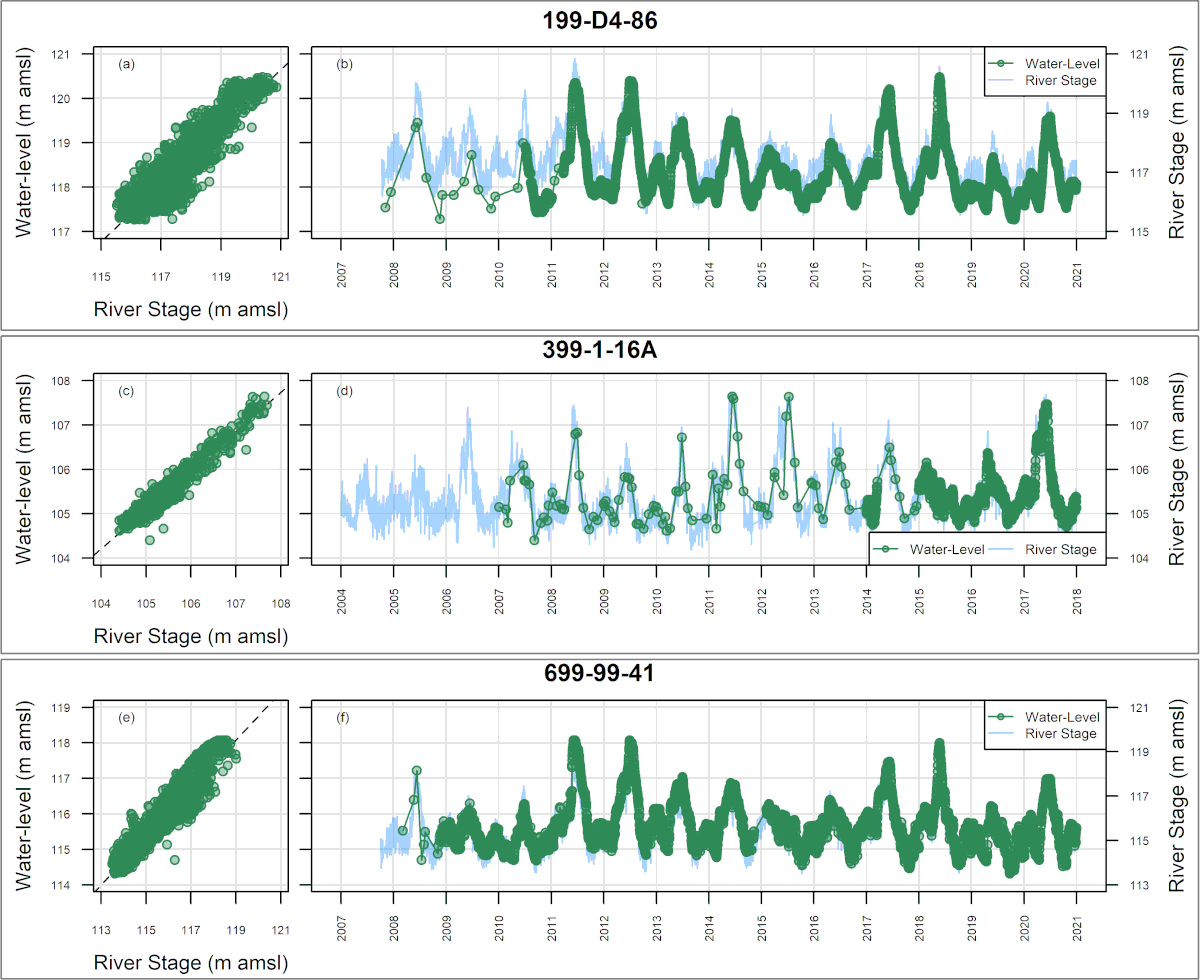
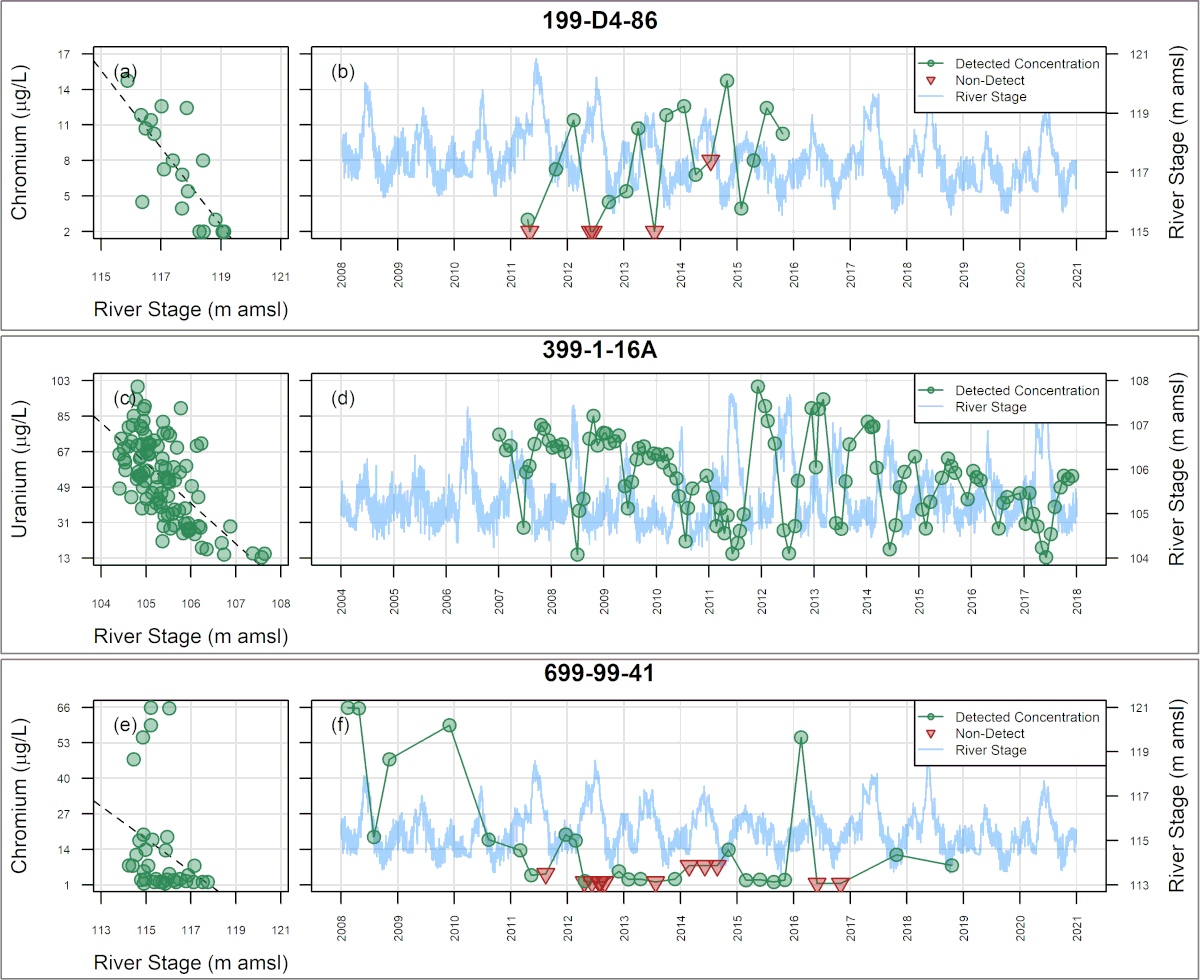
When other time-varying site-specific factors – such as changes in groundwater elevation in response to surface water level fluctuations – are related to or indeed cause concentration changes, univariate methods are unable to incorporate this in the analysis, and this variation is relegated to the “error” term. Consequently, in such situations, univariate methods are inadequate to characterize, estimate (“fit”), and then forecast, concentration variations and trends. Multivariate or multiple regression methods can incorporate additional explanatory variables, thereby minimizing the unexplained variability that is relegated to the “error” term (Equation 2).

EQUATION 2
In EQUATION 2, where X1, … Xp are independent variables that may explain a substantial part of the observed variance in sampled concentrations, β2 … βp are assumed to be constant and are estimated based on the regression method and εi is the resulting “error” term.
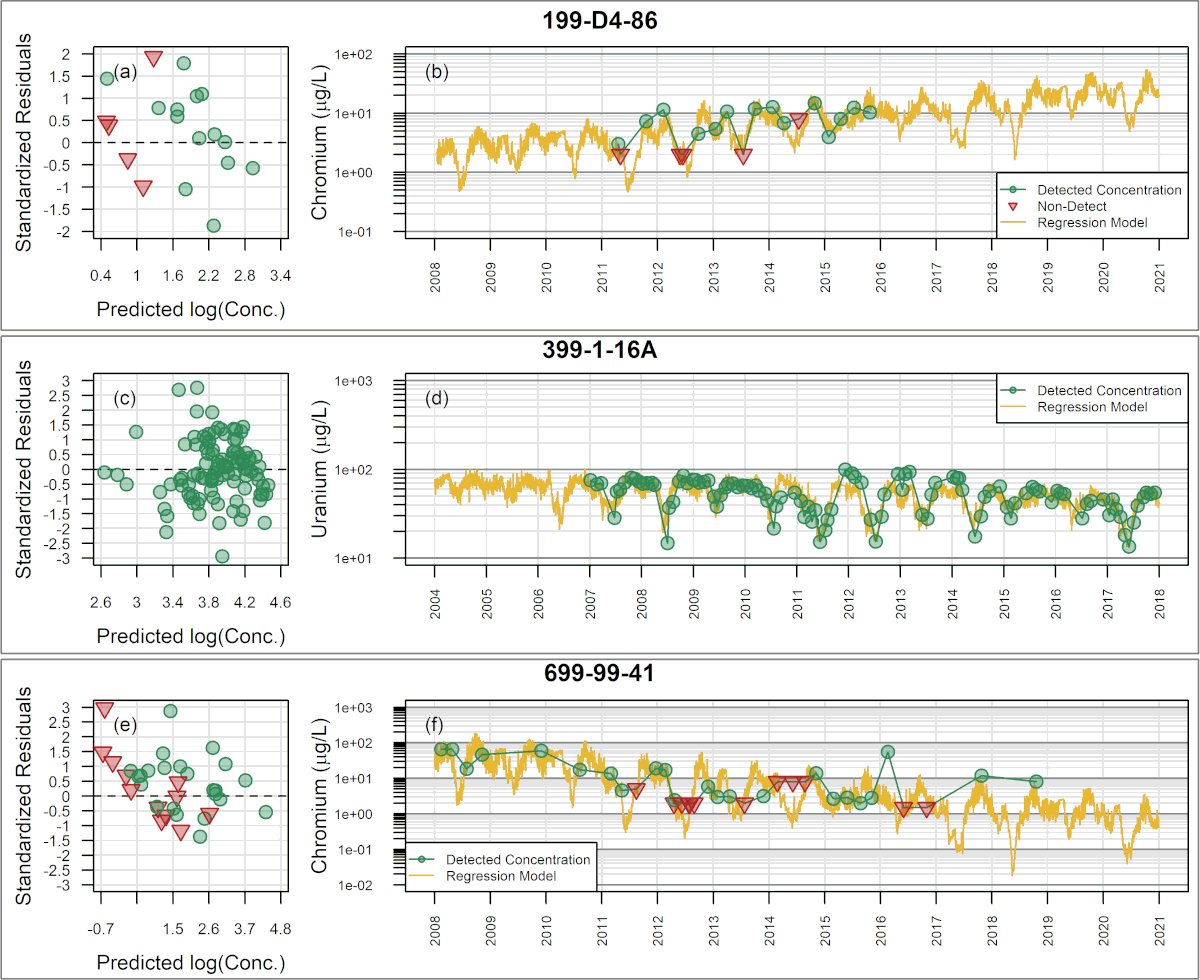
In many environmental settings, concentration variations can result in some sample results falling below laboratory reporting limits (RLs). The presence of sample results that are below RLs – often referred to as “censored data” – prohibits direct application of the common least-squares method for multiple regression, which is subject to substantial bias. As presented below, the use of Maximum Likelihood Estimation (MLE) for multiple regression analysis can enhance temporal trend analysis in the presence of both multiple independent variables and censored data to improve the characterization, estimation, and subsequent forecasting, of temporal trends.
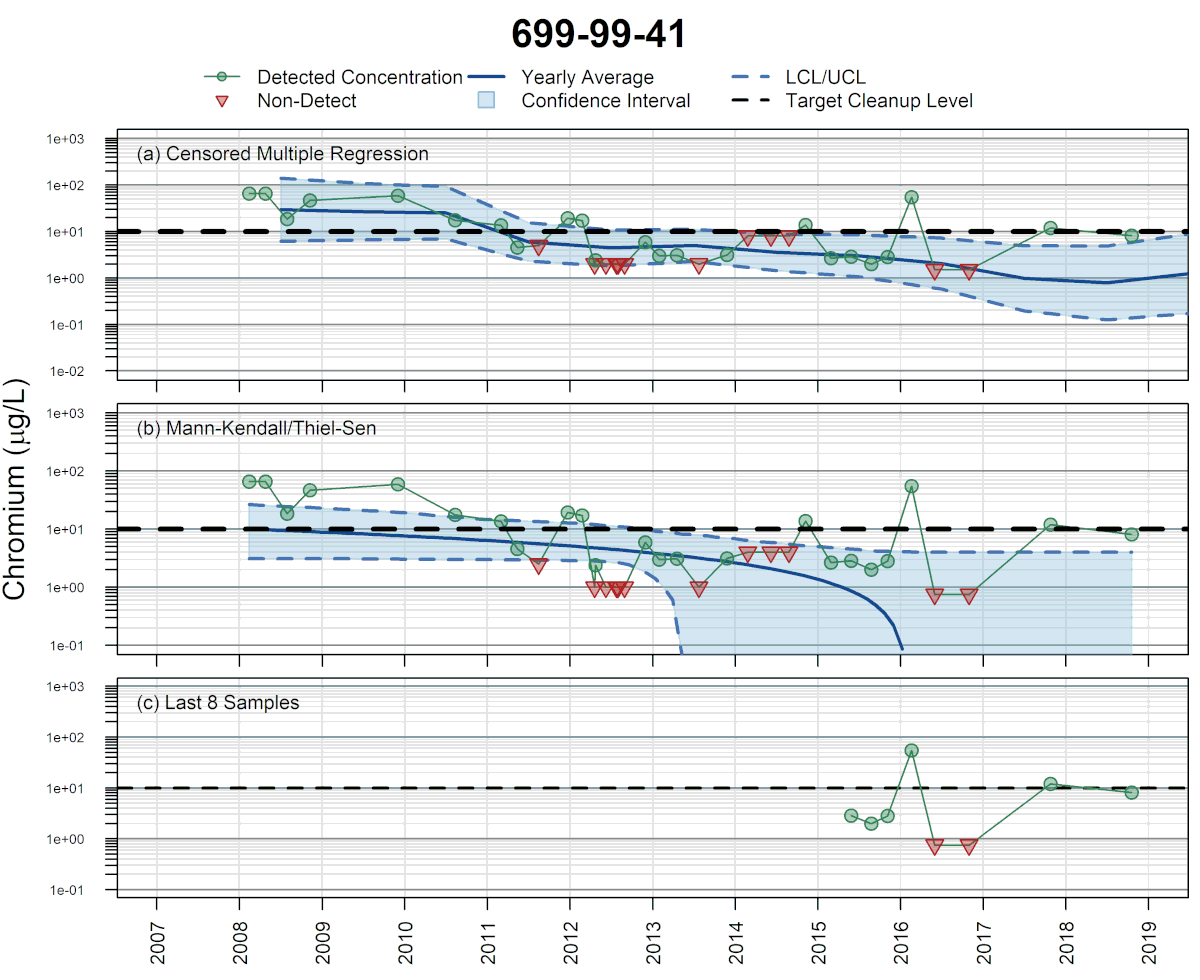
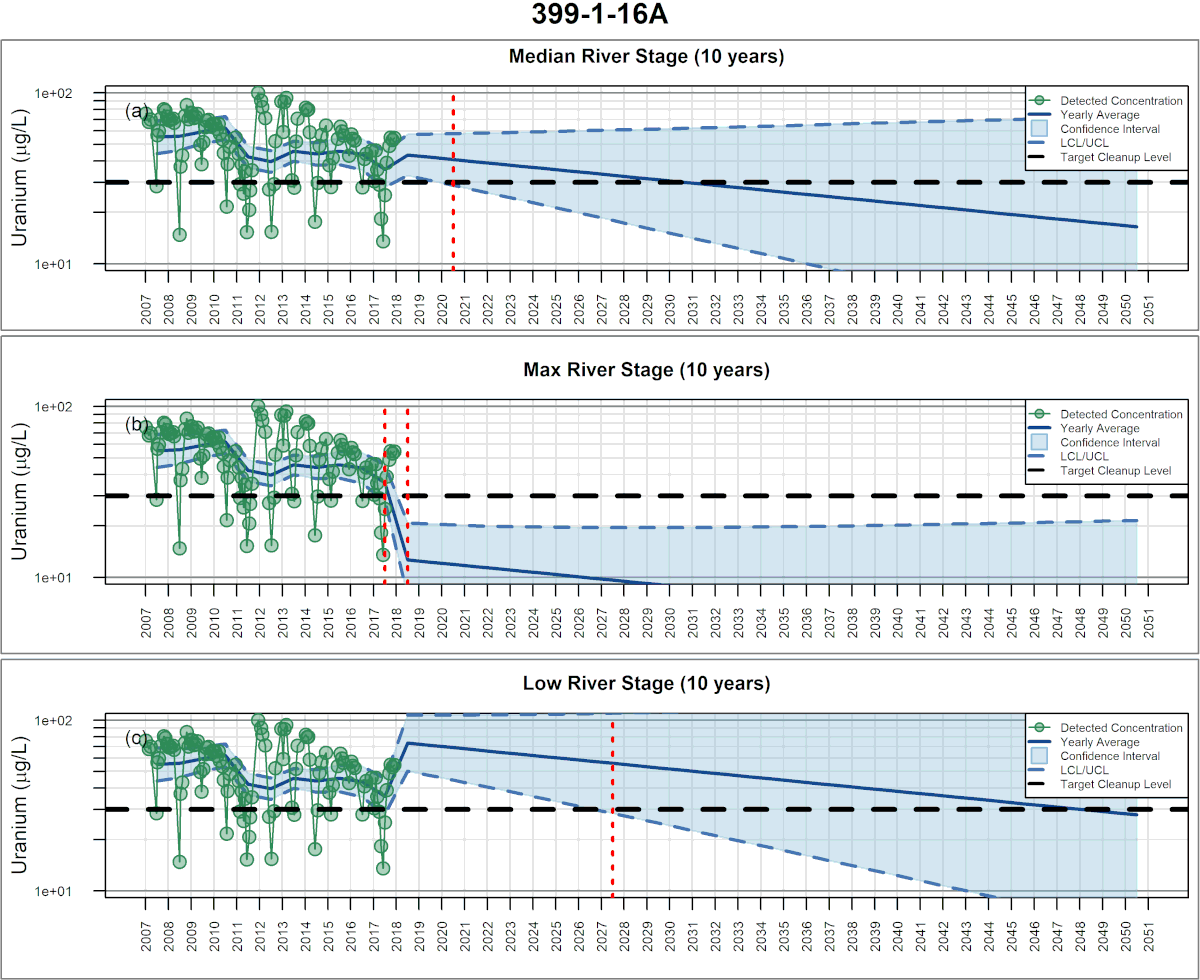
Development: In 2012, SSP&A completed a site-wide analysis of concentration trends for multiple contaminants at the U.S. Department of Energy (USDOE) Hanford Site in Richland, Washington, using traditional least-squares-based multiple regression methods. The purpose of that work was to evaluate the effect of stage-changes in the Columbia River on concentrations in shoreline wells, and thereby guide sample planning and the estimation of long-term trends. A challenge encountered during this work was that as concentrations approached tentative cleanup levels, many sample results were returned as below RLs – i.e., the data sets became increasingly censored. To mitigate this difficulty, SSP&A developed methods and a systematic procedure for undertaking multiple regression using MLE – referred to as censored multiple regression – to evaluate temporal trends in monitoring data. The methods and procedure were developed between 2013 and 2015, and first applied to evaluate the progress of monitored natural attenuation (MNA) and enhanced attenuation (EA) of inorganic, organic and radionuclides (link to SGW and ECF) at the 300-Area. This approach was later implemented at the Hanford Site (a) to evaluate temporal trends in contaminant concentrations for annual groundwater pump-and-treat (P&T) reporting and (b) to support RCRA compliance monitoring.
SSP&A has since applied these censored multiple regression methods and procedures at numerous sites throughout the United States where time-varying site-specific factors play an important role in temporal changes in groundwater chemistry and the evaluation of remedy performance and progress.
REFERENCE
DiFilippo, E., Tonkin, M., and Huber, W., 2023. Use of Censored Multiple Regression to Interpret Temporal Environmental Data and Assess Remedy Progress. Groundwater, vol 61, no. 6: 846-864. doi: 10.1111/gwat.13315
Example Figures
DISCLAIMER: SSP&A’s software is provided “AS IS”, without warranty of any kind, including, without limitation, the warranties of merchantability, fitness for a particular purpose and non-infringement. We request only that application of the software and production of results using the code is accompanied by a suitable acknowledgment. The entire risk and responsibility as to the quality and performance of the Software is borne by the user. SSP&A disclaims all other warranties.

