Censored Multiple Regression (Tobit)
Background
Many methods in common use to evaluate temporal trends in monitoring data rely upon univariate techniques that account for changes in measured concentrations by means of a single variable, namely time. The application of most temporal trend analysis methods in groundwater monitoring – such as parametric ordinary least squares (OLS) or the non-parametric Mann-Kendall test – time is usually the sole explanatory (or independent) variable and measurements of groundwater concentration provide the response (or dependent) variable. With these methods, any variability in concentration values not specifically associated with the time variable is relegated to the “error” term (Equation 1).
where y is the sampled concentration, t is time, β0 and β1 are assumed to be constant and are estimated based on the regression method, and ε is the “error” term.
When other time-varying site-specific factors – such as changes in groundwater elevation in response to surface water level fluctuations – are related to or indeed cause concentration changes, univariate methods are unable to incorporate this in the analysis, and this variation is relegated to the “error” term. Consequently, in such situations, univariate methods are inadequate to characterize, estimate (“fit”), and then forecast, concentration variations and trends. Multivariate or multiple regression methods can incorporate additional explanatory variables, thereby minimizing the unexplained variability that is relegated to the “error” term (Equation 2).

where X1, … Xp are independent variables that may explain a substantial part of the observed variance in sampled concentrations, β2 … βp are assumed to be constant and are estimated based on the regression method and εi is the resulting “error” term.
In many environmental settings, concentration variations can result in some sample results falling below laboratory reporting limits (RLs). The presence of sample results that are below RLs – often referred to as “censored data” – prohibits direct application of the common least-squares method for multiple regression, which are subject to substantial bias. As presented below, the use of Maximum Likelihood Estimation (MLE) for multiple regression analysis can enhance temporal trend analysis in the presence of both multiple independent variables and censored data to improve the characterization, estimation, and subsequent forecasting, of temporal trends.
Development
SSP&A completed in 2012 a site-wide analysis of concentration trends for multiple contaminants at the U.S. Department of Energy (USDOE) Hanford Site in Richland, Washington, using traditional least-squares-based multiple regression methods. The purpose of that work was to evaluate the effect of stage-changes in the Columbia River on concentrations in shoreline wells, and thereby guide sample planning and the estimation of long-term trends. A challenge encountered during this work was that as concentrations approached tentative cleanup levels, many sample results were returned as below RLs – i.e., the data sets became increasingly censored. To mitigate this difficulty, SSP&A developed methods and a systematic procedure for undertaking multiple regression using MLE – referred to as censored multiple regression – to evaluate temporal trends in monitoring data. The methods and procedure were developed between 2013 and 2015, and first applied to evaluate the progress of monitored natural attenuation (MNA) and enhanced attenuation (EA) of inorganic, organic and radionuclides (link to SGW and ECF) at the 300-Area. This approach was later implemented at the Hanford Site (a) to evaluate temporal trends in contaminant concentrations for annual groundwater pump-and-treat (P&T) reporting and (b) to support RCRA compliance monitoring.
SSP&A has since applied these censored multiple regression methods and procedures at numerous sites throughout the United States where time-varying site-specific factors play an important role in temporal changes in groundwater chemistry and the evaluation of remedy performance and progress.
Example Publications
SSP&A has documented the application of the censored multiple regression methods and procedures in numerous Hanford documents, at technical conferences and meetings and in a recently accepted peer-reviewed paper. Links to documents that are publicly available are provided below:
· Hanford Site Soil and Groundwater (SGW) report:
o http://pdw.hanford.gov/arpir/index.cfm/viewDoc?accession=0079695H
· Hanford Site Environmental Calculation Form (ECF):
o http://pdw.hanford.gov/arpir/index.cfm/viewDoc?accession=0079510H
· American Geophysical Union (AGU) presentation abstract:
o https://agu.confex.com/agu/fm18/meetingapp.cgi/Paper/375821
· Waste Management Meeting (WMM) presentation abstract:
o https://www.proceedings.com/content/051/051905webtoc.pdf
· Peer-reviewed publication in Groundwater:
o https://ngwa.onlinelibrary.wiley.com/doi/10.1111/gwat.13315
Example Application
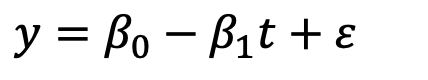
Along the downgradient shoreline perimeter of Hanford Site, time series plots of measured groundwater elevation and the stage of the Columbia River indicate a strong hydraulic connection between the river and aquifer: groundwater levels rise and fall in a positive correlation with river stage (Figure 1). A relationship is also evident between river stage and the concentration measured at the monitoring wells. However, unlike the consistently positive correlation between river stage and groundwater levels observed in these monitoring wells, a negative correlation is often observed between sampled concentrations and river stage: that is, when the river stage rises, concentrations decrease and when river stage falls, concentrations increase (Figure 2). Censored multiple regression was used to evaluate concentration changes at monitoring wells while enabling concentrations to vary as a function of both time and river stage (Figure 3), incorporating a procedure to estimate the lag-time between river stage changes and concentration changes.
The estimated yearly mean concentration and confidence interval (CI) of the yearly mean concentrations were calculated at each well using the censored multiple regression approach. The yearly mean concentration is, by definition, a measure of the central tendency of the data. It is likely that individual sampled concentrations throughout the year will fall below or above the CI of the yearly mean. To illustrate the benefit of this approach, the censored multiple regression results were compared to those obtained using the traditional Mann-Kendall/Thiel-Sen approach. Confidence intervals of the yearly mean for the Thiel-Sen method were calculated using a bootstrapping method, as outlined in EPA’s Unified Guidance (EPA 2009) (Figure 4).
At well 699-99-41, while individual sampling events exceeded a tentative target cleanup level (10 µg/L), the yearly mean based on the censored multiple regression approach fell below the cleanup level in 2011 and the UCL of the mean, based on the same approach, fell below the cleanup level in 2014 (Figure 5a). In contrast, the Mann-Kendall/Thiel-Sen approach calculated a yearly mean below the target cleanup level in 2008 (Figure 5b). The Mann-Kendall/Thiel-Sen approach also calculated that the UCL of the yearly mean was below the target cleanup level two years before the censored multiple regression approach. The yearly mean and CI of the yearly mean is more consistent with the measured data when using the censored multiple regression approach compared to the univariate Mann-Kendall/Thiel-Sen approach. If only the last eight samples are used to assess remedial performance, then no statistically significant trend present and the UCL of the mean, calculated using temporally stationary methods, is above the target cleanup level, leading to the conclusion that remediation is not progressing. This is inconsistent with the long-term temporal trends at this location.
Predicting future mean concentrations or computing confidence intervals for them requires that future values of the river stage be prescribed, because we do not directly model uncertainty in river stage forecasts. This apparent limitation actually offers valuable data analysis opportunities. For example, future values can be selected to reflect a variety of future basin scenarios, including status quo where future river stages are similar to current conditions, extended drought conditions where river stage is low for years or decades, or extended wet periods where river stage is high for years or decades. Thus, instead of burying the effects of potential changes within the random components of a statistical model, this approach requires generating a set of scenarios to analyze those effects. Figure 6 depicts the yearly mean and confidence interval of the mean for past measurements and the modeled future concentrations of uranium at well 399-1-16A for three such scenarios. For the status quo scenario, the future river stage is prescribed to be the median of the daily (time-varying) river stage over the past 10 years. In this scenario, the lower confidence limit (LCL) of the yearly mean falls below the target cleanup level in 2020, the yearly mean concentration falls below the target cleanup level in 2031, and the upper confidence limit (UCL) is less than the target cleanup level by 2050, indicating the cleanup goal will likely be attained by then. For the extended wet period scenario, the future river stage was assumed to be the maximum of the daily (time-varying) river stage of the past 10 years. Because uranium concentrations are negatively correlated with river stage, this scenario predicts attainment would be achieved by 2018 (the UCL is below the target cleanup level). For the extended drought conditions, the future river stage was prescribed to be the minimum of the daily (time-varying) river stage of the past 10 years. The negative correlation with river stage results in higher predicted concentrations in this scenario, so attainment is not likely until farther in the future. It is important to note that these interpretations are based solely on the regression analyses: other factors would have to be taken into consideration before making decisions about the status of the cleanup program, including assessing the disposition, character, and persistence of any possible continuing sources of uranium in the aquifer.
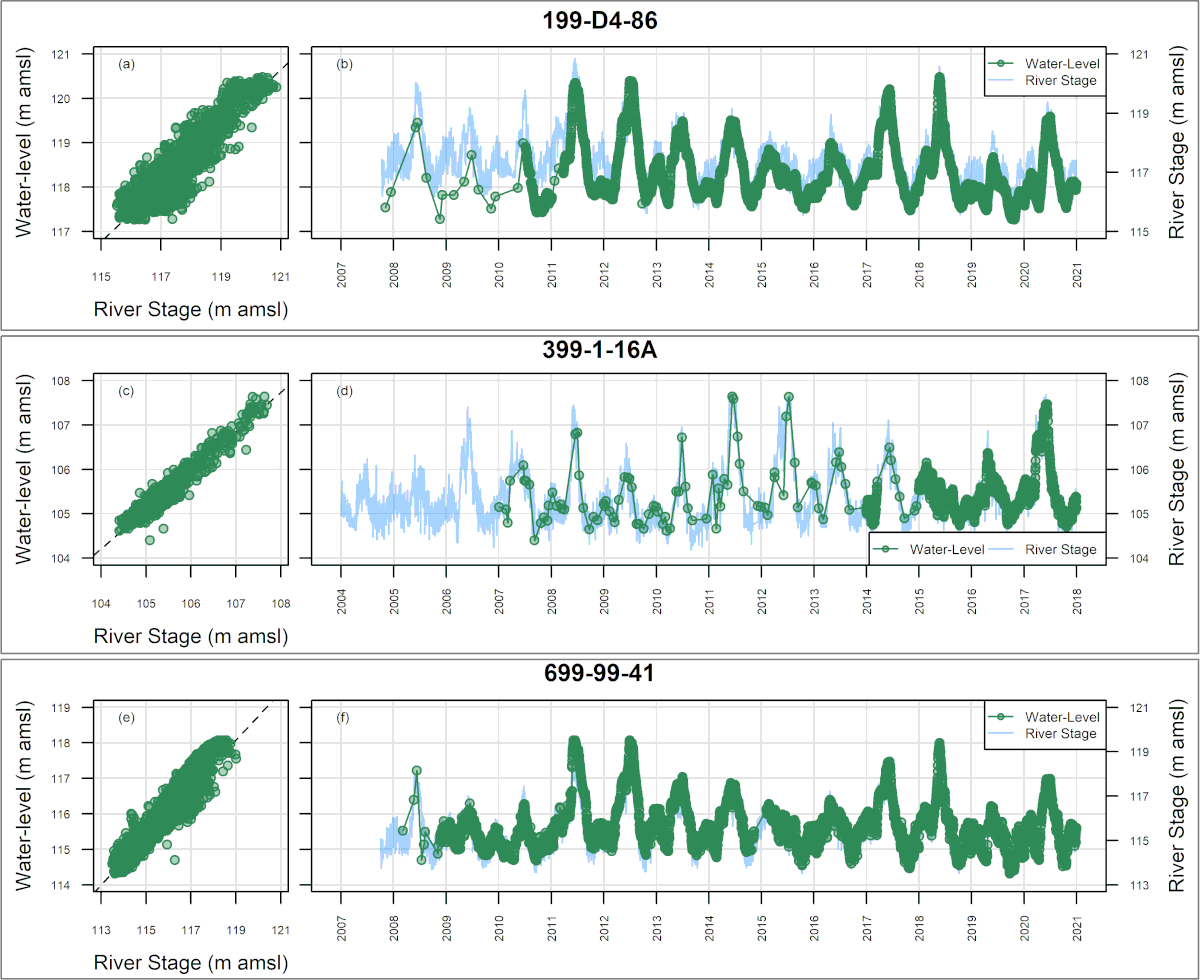
Figure 1. Relationship between Water Levels and River Stage
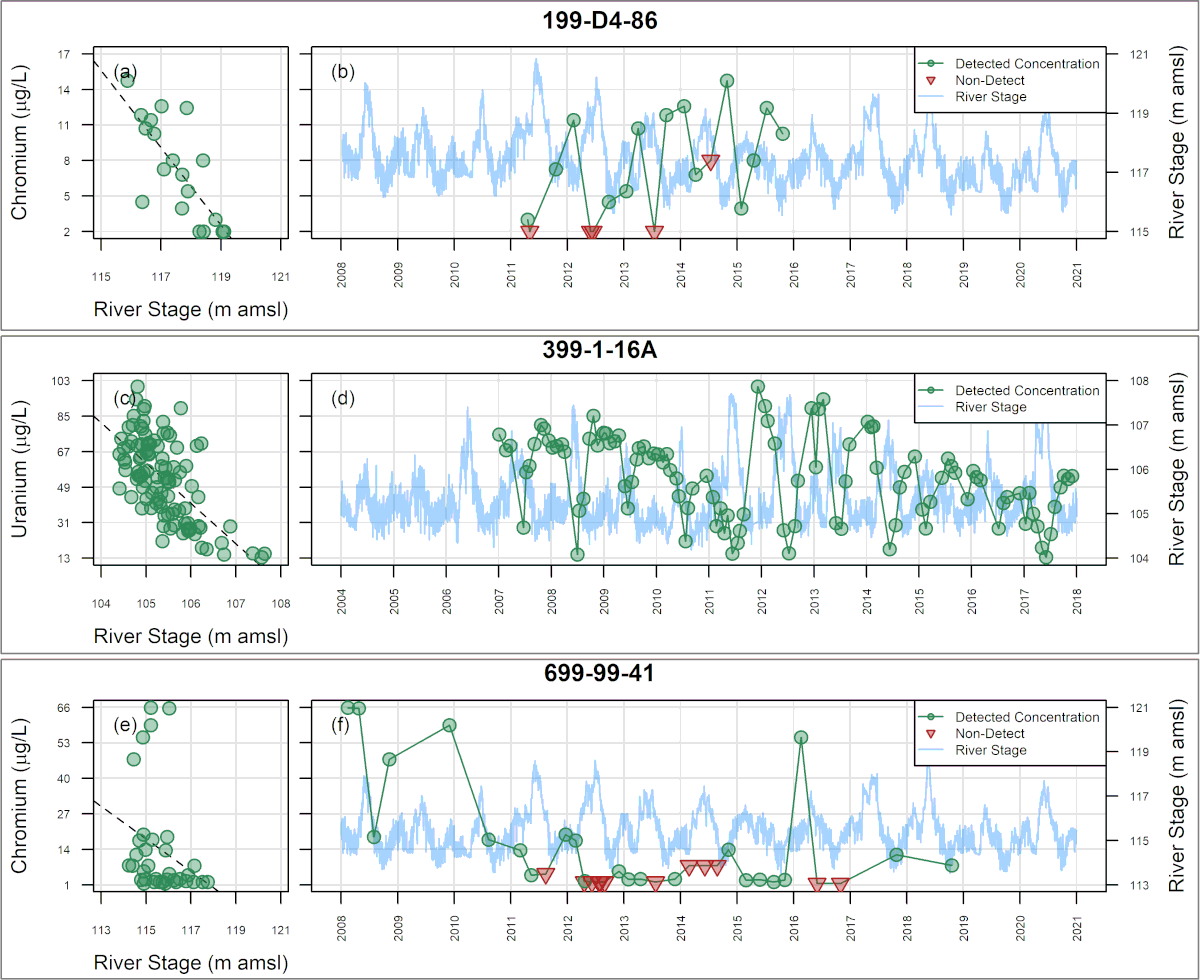
Figure 2. Relationship between Concentration and River Stage
Figure 3. Multiple Regression Model Results
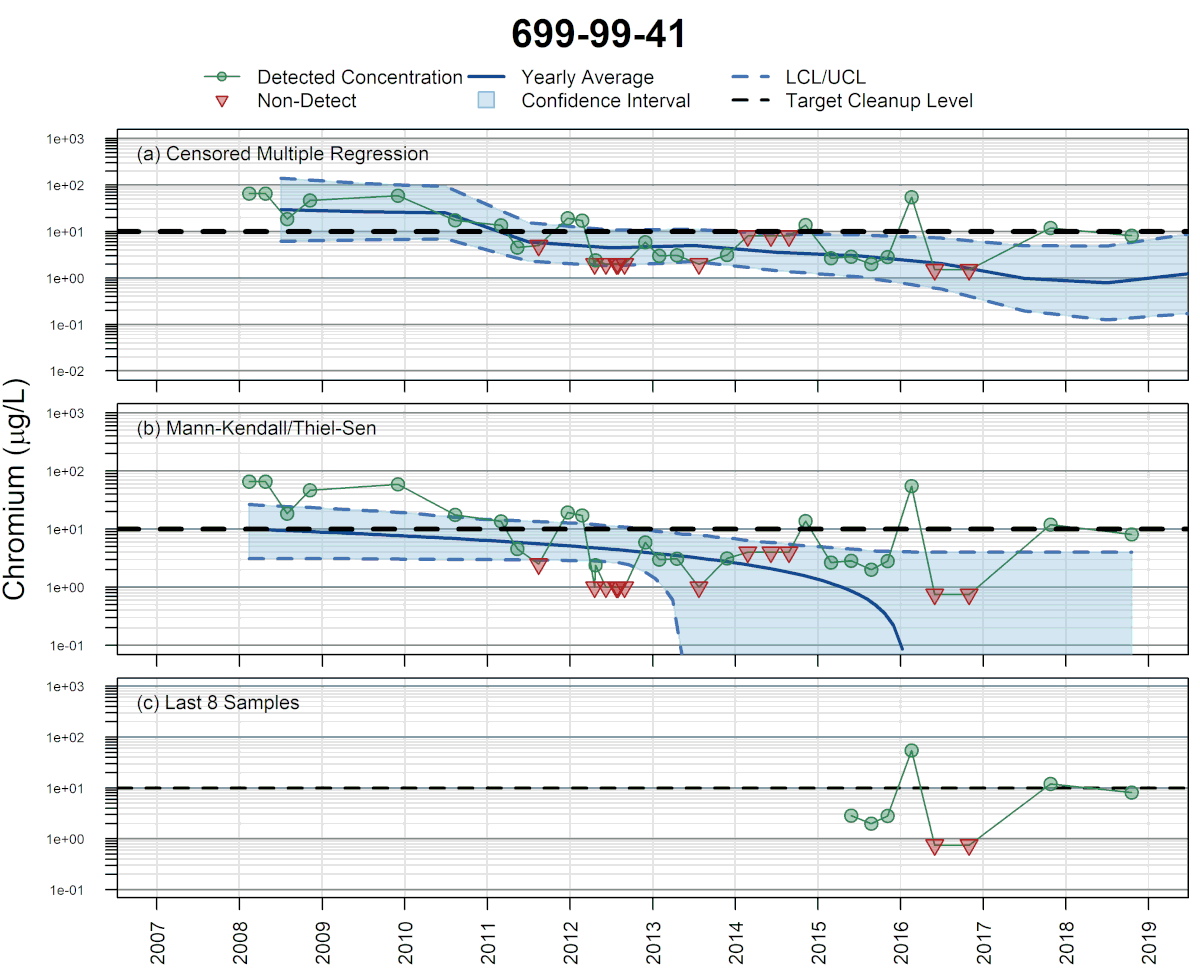
Figure 4. Time series of concentration of chromium at well 699-99-41and yearly mean Concentrations based on (a) censored multiple regression Model, (b) Mann-Kendall/Thiel-Sen model and (c) last eight samples.
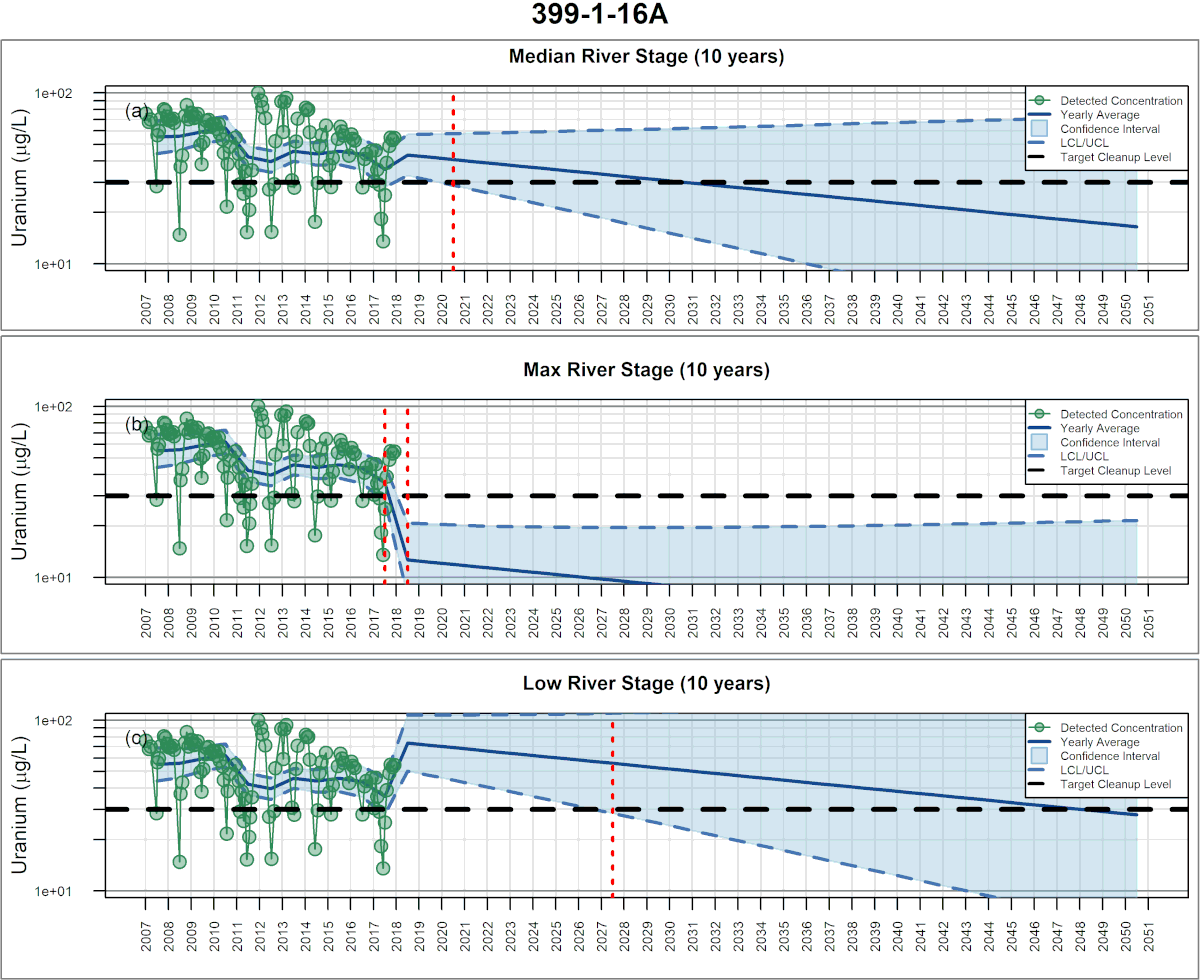
Figure 5. Time series of Predicted Future Yearly Mean Concentrations and Confidence Intervals for the Yearly Geometric Mean. (a) Status Quo Scenario. (b) Future Extended Wet Period Scenario. (c) Future Extended Drought Conditions Scenario.